 foxxcyber/docs
KPIs, forecast, budget and scenarios
Read the numbers a finance lead watches, see your cash week by week and how long it lasts, budget each account by month against what the books show, try what-ifs such as a hire or a lost customer, and see where each project is heading.
The screens under Finance → Analysis answer the questions a finance lead asks first: how are we doing, how much cash will we have, how long does it last, are we spending what we planned, what happens if we hire someone, and which projects will run over. They read what Foxx HQ already records, so there is nothing to keep up to date by hand.
Before you start
- You need Finance access. See Finance overview.
- The forecast starts from cash on the books, the bank and clearing accounts in the general ledger. If you pay bills from your own money, record what you put in as an owner contribution first, or the forecast starts below zero. See Ledger and reports.
KPIs
Open Finance → KPIs.
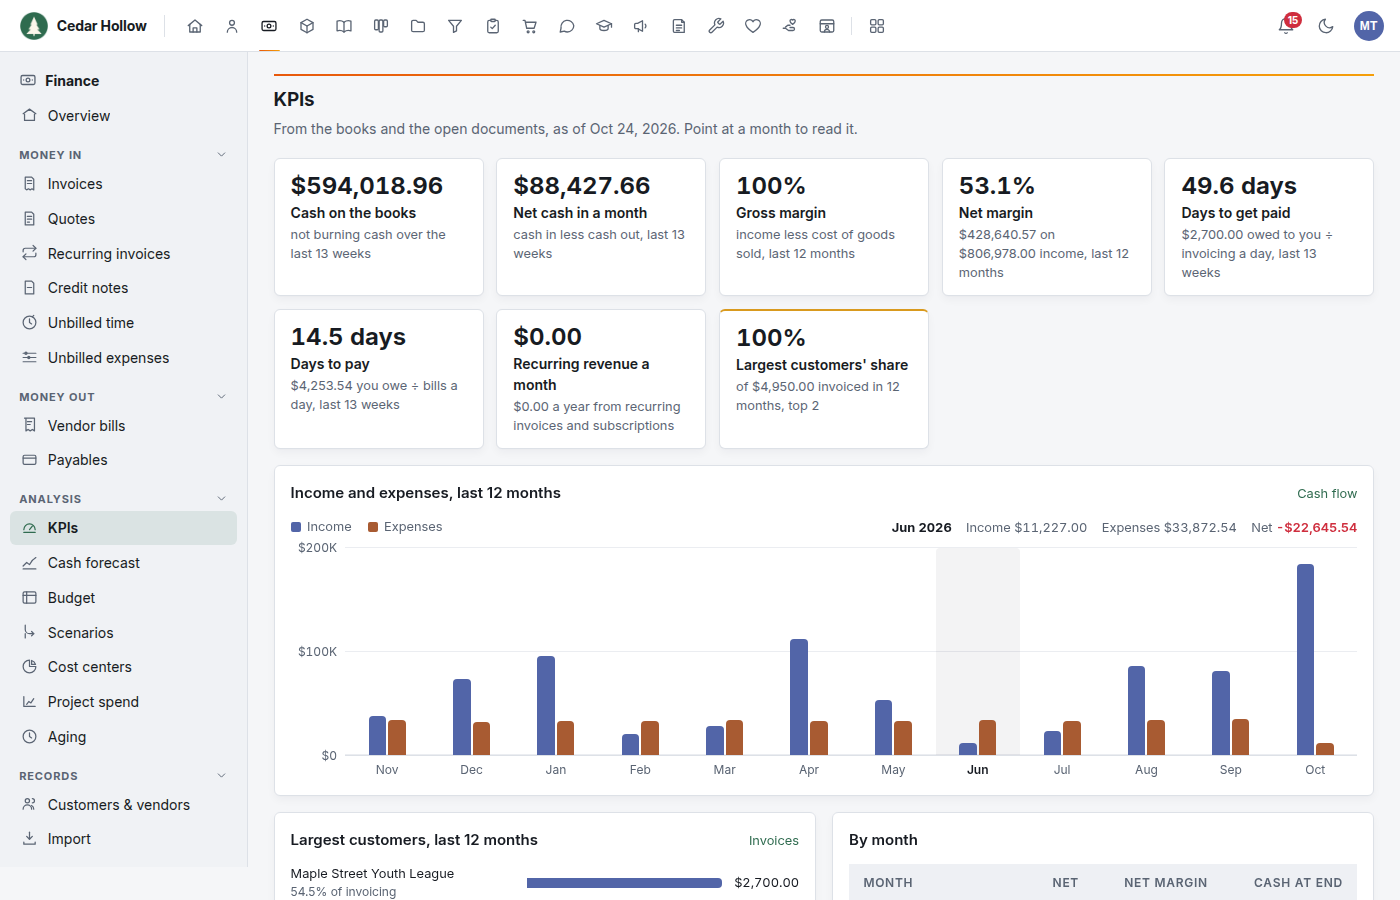
| KPI | What it is |
|---|---|
| Cash on the books | The bank and clearing accounts today, with runway. |
| Burn a month | Cash out less cash in over the last 13 weeks, as a month. When more came in than went out, the tile shows Net cash in a month instead. |
| Gross margin | Income less cost of goods sold, over the last 12 months, as a share of income. With no cost of goods sold it is 100%. |
| Net margin | Income less all expenses, over the last 12 months, as a share of income. |
| Days to get paid | What customers owe you ÷ a day's invoicing over the last 13 weeks. |
| Days to pay | What you owe vendors ÷ a day's bills over the last 13 weeks. |
| Recurring revenue a month | Active recurring invoices and Stripe subscriptions still renewing, each brought to a month. |
| Largest customers' share | How much of the last 12 months' invoicing came from your five largest customers. Outlined when it is 80% or more. |
A dash means there was nothing to divide by, such as no invoices in the last 13 weeks. Below the tiles are twelve months of income and expenses, your largest customers, and each month's net, net margin and cash at the month's end. Click a tile to open the screen behind it.
Cash forecast
Open Finance → Cash forecast.
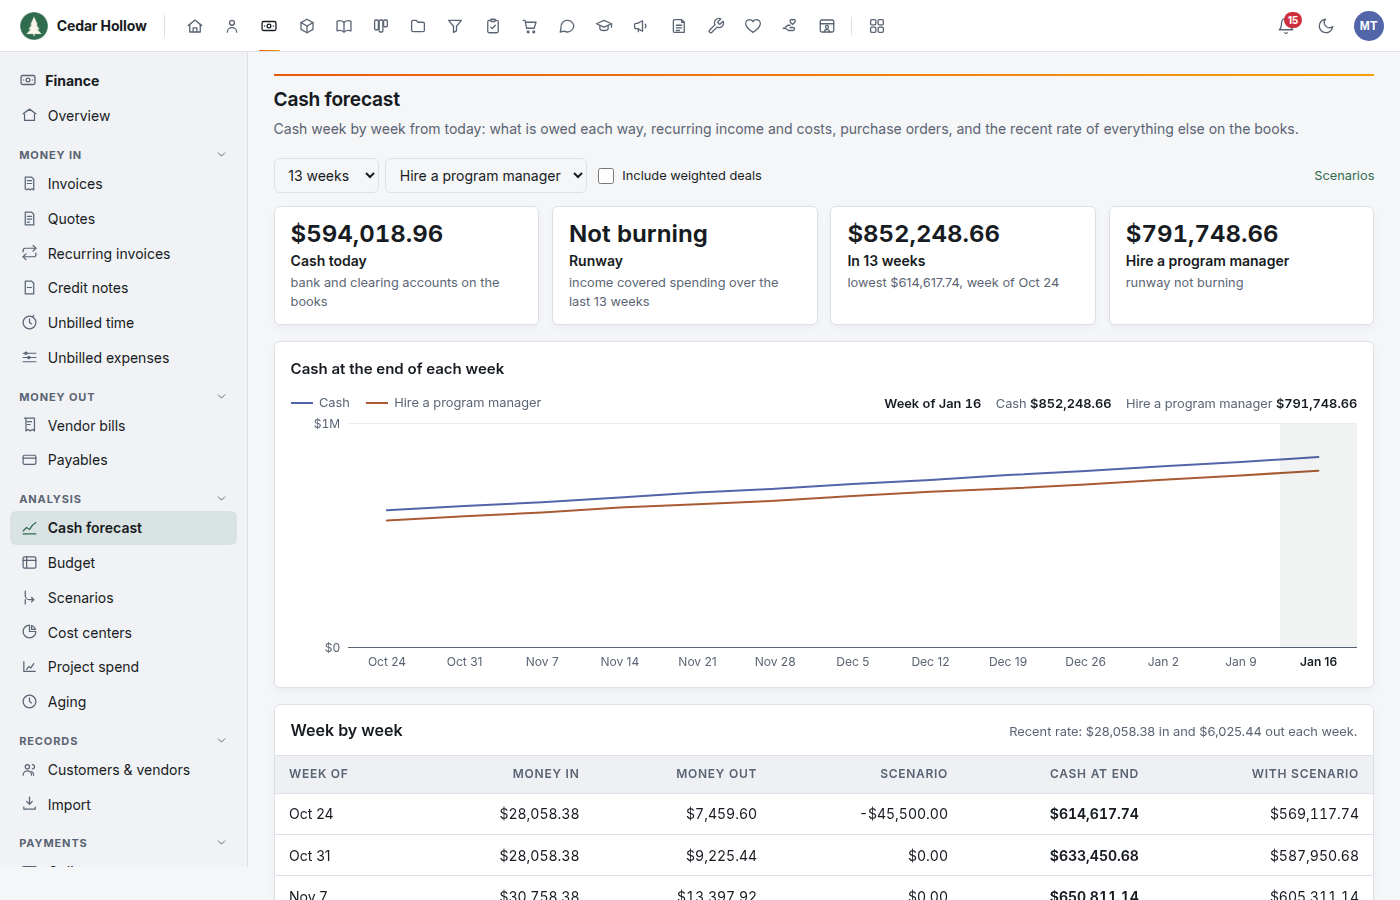
The forecast runs from today, week by week. It counts:
| Money in | Money out |
|---|---|
| Open invoices, on their due dates | Unpaid vendor bills, on their due dates |
| Recurring invoices, on each run plus the customer's payment terms | Approved expense and trip reports, in the first week (not your own: those are contributions) |
| Stripe subscriptions, at each renewal | Open purchase orders, less what is already billed, on the expected date plus the vendor's terms |
| CRM deals, weighted by their stage's win chance, when you tick Include weighted deals | Software subscriptions, on each renewal |
| Vendors billed in two of the last three months, monthly at their average |
Anything the books show with no document behind it, such as payroll posted as journal entries, gifts or card fees, runs at its rate over the last 13 weeks. Anything already due counts in the first week.
- Runway is months of cash at your monthly burn: spending less income over the last 13 weeks. "Not burning" means income covered spending.
- If cash goes below zero, the page says which week.
- Choose 13, 26 or 52 weeks. Point at the chart to read a week.
- What's in it lists every item with a link to its invoice, bill, deal or order.
Budget vs actual
Open Finance → Budget.
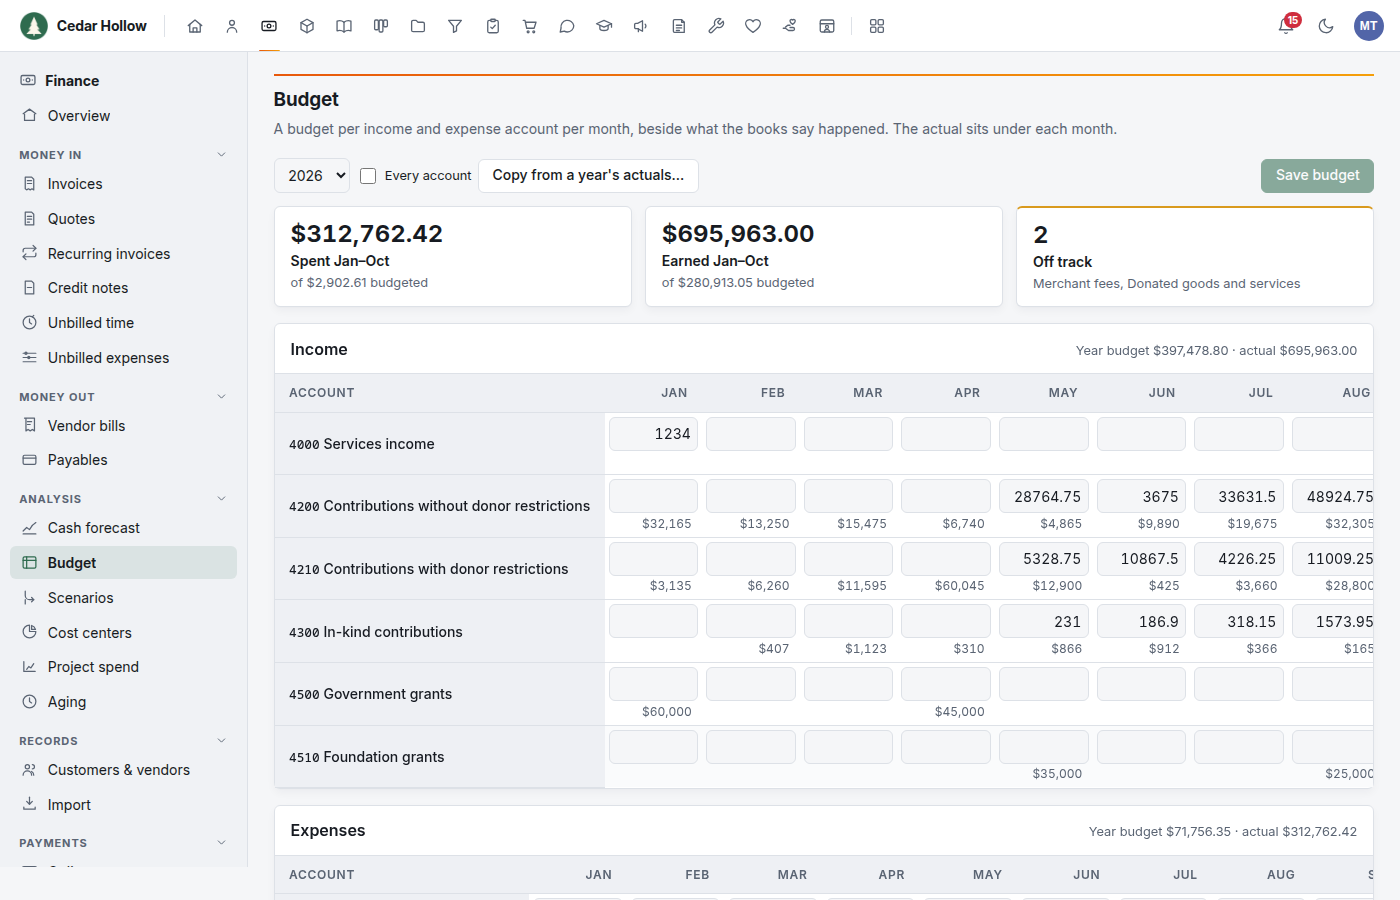
- Pick the year.
- Type a budget in each month for each income and expense account. Each month's actual from the books sits under its box, in red when an expense went over. Tick Every account to budget an account with no activity yet.
- Click Save budget. Only the accounts you changed are saved.
The columns on the right show the budget and actual so far this year and the variance: under budget is good for an expense, ahead is good for income. Accounts behind plan are listed as Off track, and the Finance overview shows Spent against budget once a budget exists.
To start from last year, click Copy from a year's actuals…, choose the year and a change (for example 5 for five percent more), and confirm. This replaces the whole year's budget.
Scenarios
Open Finance → Scenarios and click New scenario.
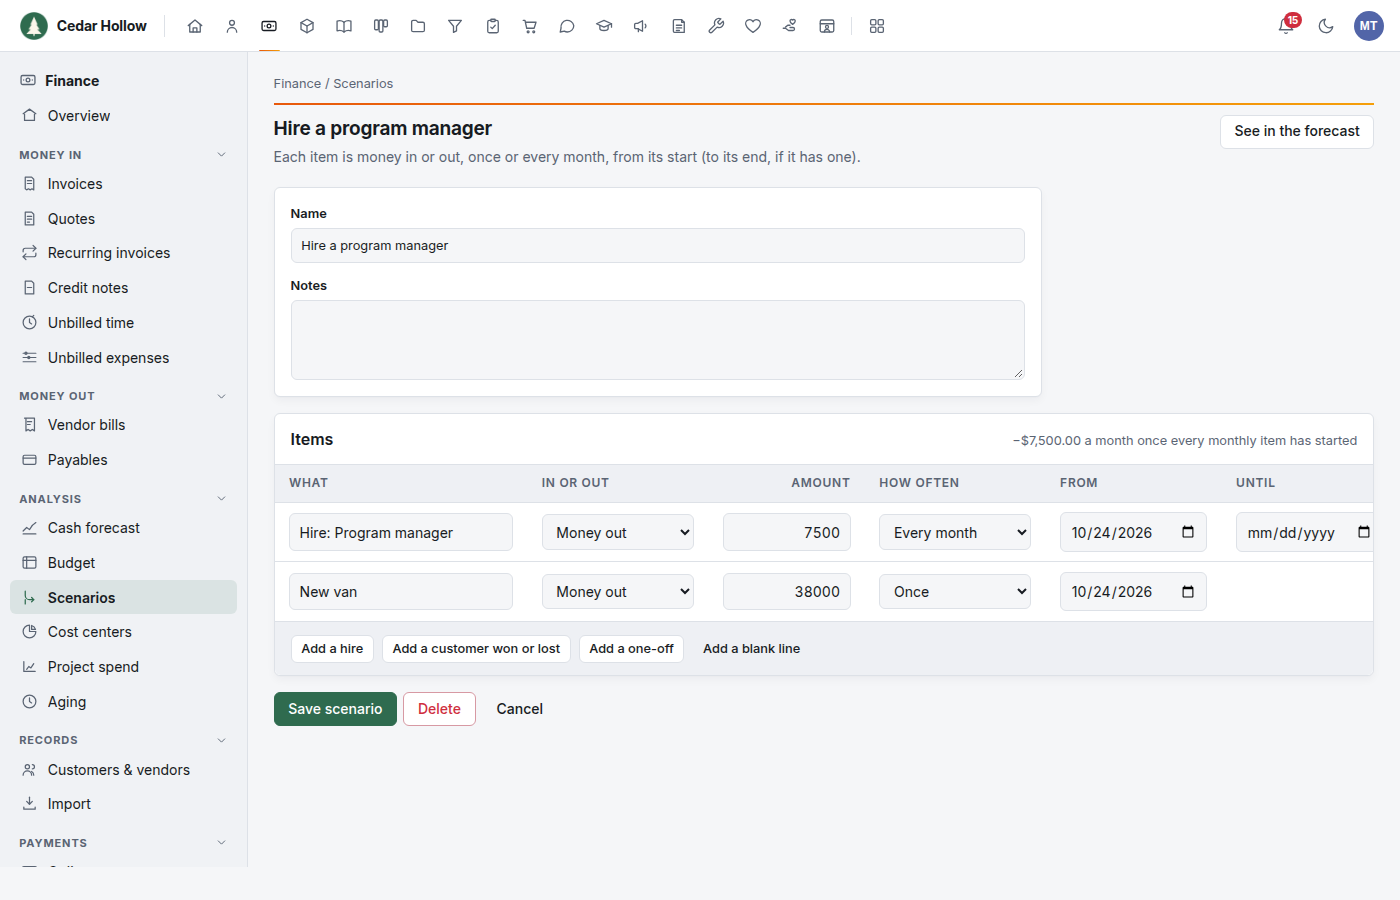
- Give it a Name.
- Add items:
- Add a hire: the role, annual salary and benefits and taxes as a percentage. The monthly cost is the total over twelve months.
- Add a customer won or lost: the monthly revenue that starts or stops.
- Add a one-off: a purchase or a payment in, on a date.
- Add a blank line for anything else: money in or out, once or every month, from a date and (optionally) until one.
- Click Save scenario, then See in the forecast.
The forecast shows the scenario as its own line and column beside your cash, with its own ending cash and runway. Scenarios never change the books.
Where each project is heading
Open Finance → Project spend. Under each project's spend so far, Where each project is heading projects every charge code that is spending or has an end date, at its spend over the last 12 weeks.
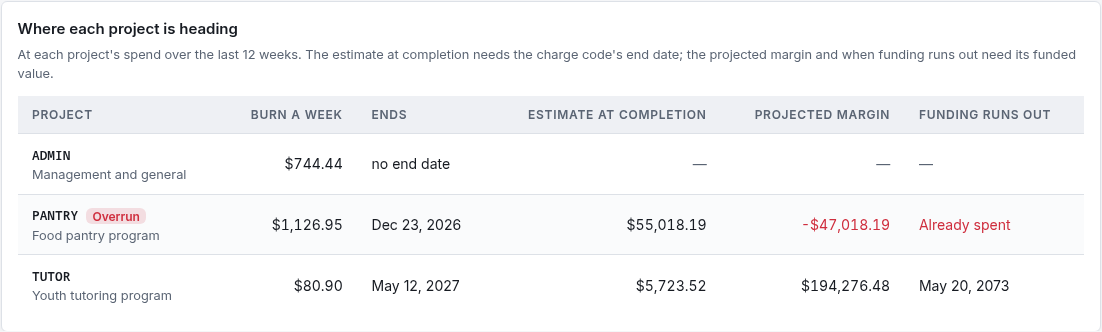
- Burn a week: the code's expenses, labor and vendor bills over the last 12 weeks, divided by 12.
- Estimate at completion: spent so far plus the weekly burn until the code's end date. Set the end date on the charge code.
- Projected margin: the funded value less the estimate at completion. Set the funded value on the charge code.
- Funding runs out: the date the funded value is spent at the weekly burn, or Already spent.
- Overrun marks a code whose estimate is above its funding, or whose funding runs out before its end date.
Ask Claude
If your organization has connected Claude as its AI advisor, it can read the KPIs, the cash flow statement, the forecast, the budget, the scenarios and the project projections, and save a budget or a scenario for you within the Finance access you gave it.
Troubleshooting
The forecast starts below zero. Cash on the books is negative, often because bills were marked paid with no money recorded going in. Record an owner contribution or the bank deposit that paid them.
A monthly vendor is missing from the forecast. Only vendors billed in at least two of the last three calendar months are forecast monthly. A vendor with a software subscription under Inventory is forecast from the subscription instead.
The budget shows nothing. It lists accounts with a budget or activity in the year. Tick Every account to see the rest.
A KPI shows a dash. There was nothing to divide by: no income in the last 12 months for a margin, or no invoices or bills in the last 13 weeks for days to get paid or to pay.
A project has no estimate at completion. Its charge code has no end date. Set the period of performance end on the charge code.